
It is now simpler than ever to report a power cut. If you want to report a power cut call...
DEMAND HEAT MAP
MAP USER GUIDE

Use the icons to display areas of high, medium and low availability/demand.
Use the icons to display the specific supply types.
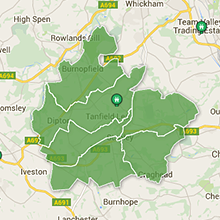
Roll over a supply type to see the post code it covers.
Click on a supply type to find out related information.
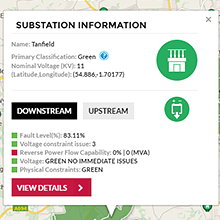
Substation Information
Name:
Nominal Voltage (kV):

Is the ideal voltage at which the network and the assets are designed to operate. Although for the majority of the times, the "operating voltage" at high voltage is slightly different from the nominal voltage. Northern Powergrid 11 and 20kV networks normally operate at 11.1/11.3kV and 20.1/20.3kV to ensure that our customer voltages are within the statutory voltage limits.
Firm Capacity
Load (MVA):
Maximum / Minimum Load
This is the power flow and has been indicated by Maximum (Max)/Minimum (Min) MVA values. The Max value is the maximum demand on the primary substation and the Min value is the minimum demand left on the primary substation after deducting the existing distributed generation. A negative minimum value indicates the existing amount of reverse power flow already flowing through the primary transformers.
Maximum (MVA):
Minimum (MVA):
Accepted Demand
Accepted Demand (Including demand connected at lower voltages):
Transformer Rating (ONAN)
The primary transformers normally have two ratings i.e. rating with forced cooling (OFAF) and rating with natural cooling (ONAN). The forced cooled rating is only used in emergency situation for short periods of time. To avoid overstressing the cooling equipment, Northern Powergrid policies dictates that the maximum amount of generation that we can connect on an unconstrained basis is dependant on the naturally cooled transformer rating of a single transformer.
Load (MVA):
Generation (MVA):
Location Data
(Latitude,Longitude):
Postcodes served: